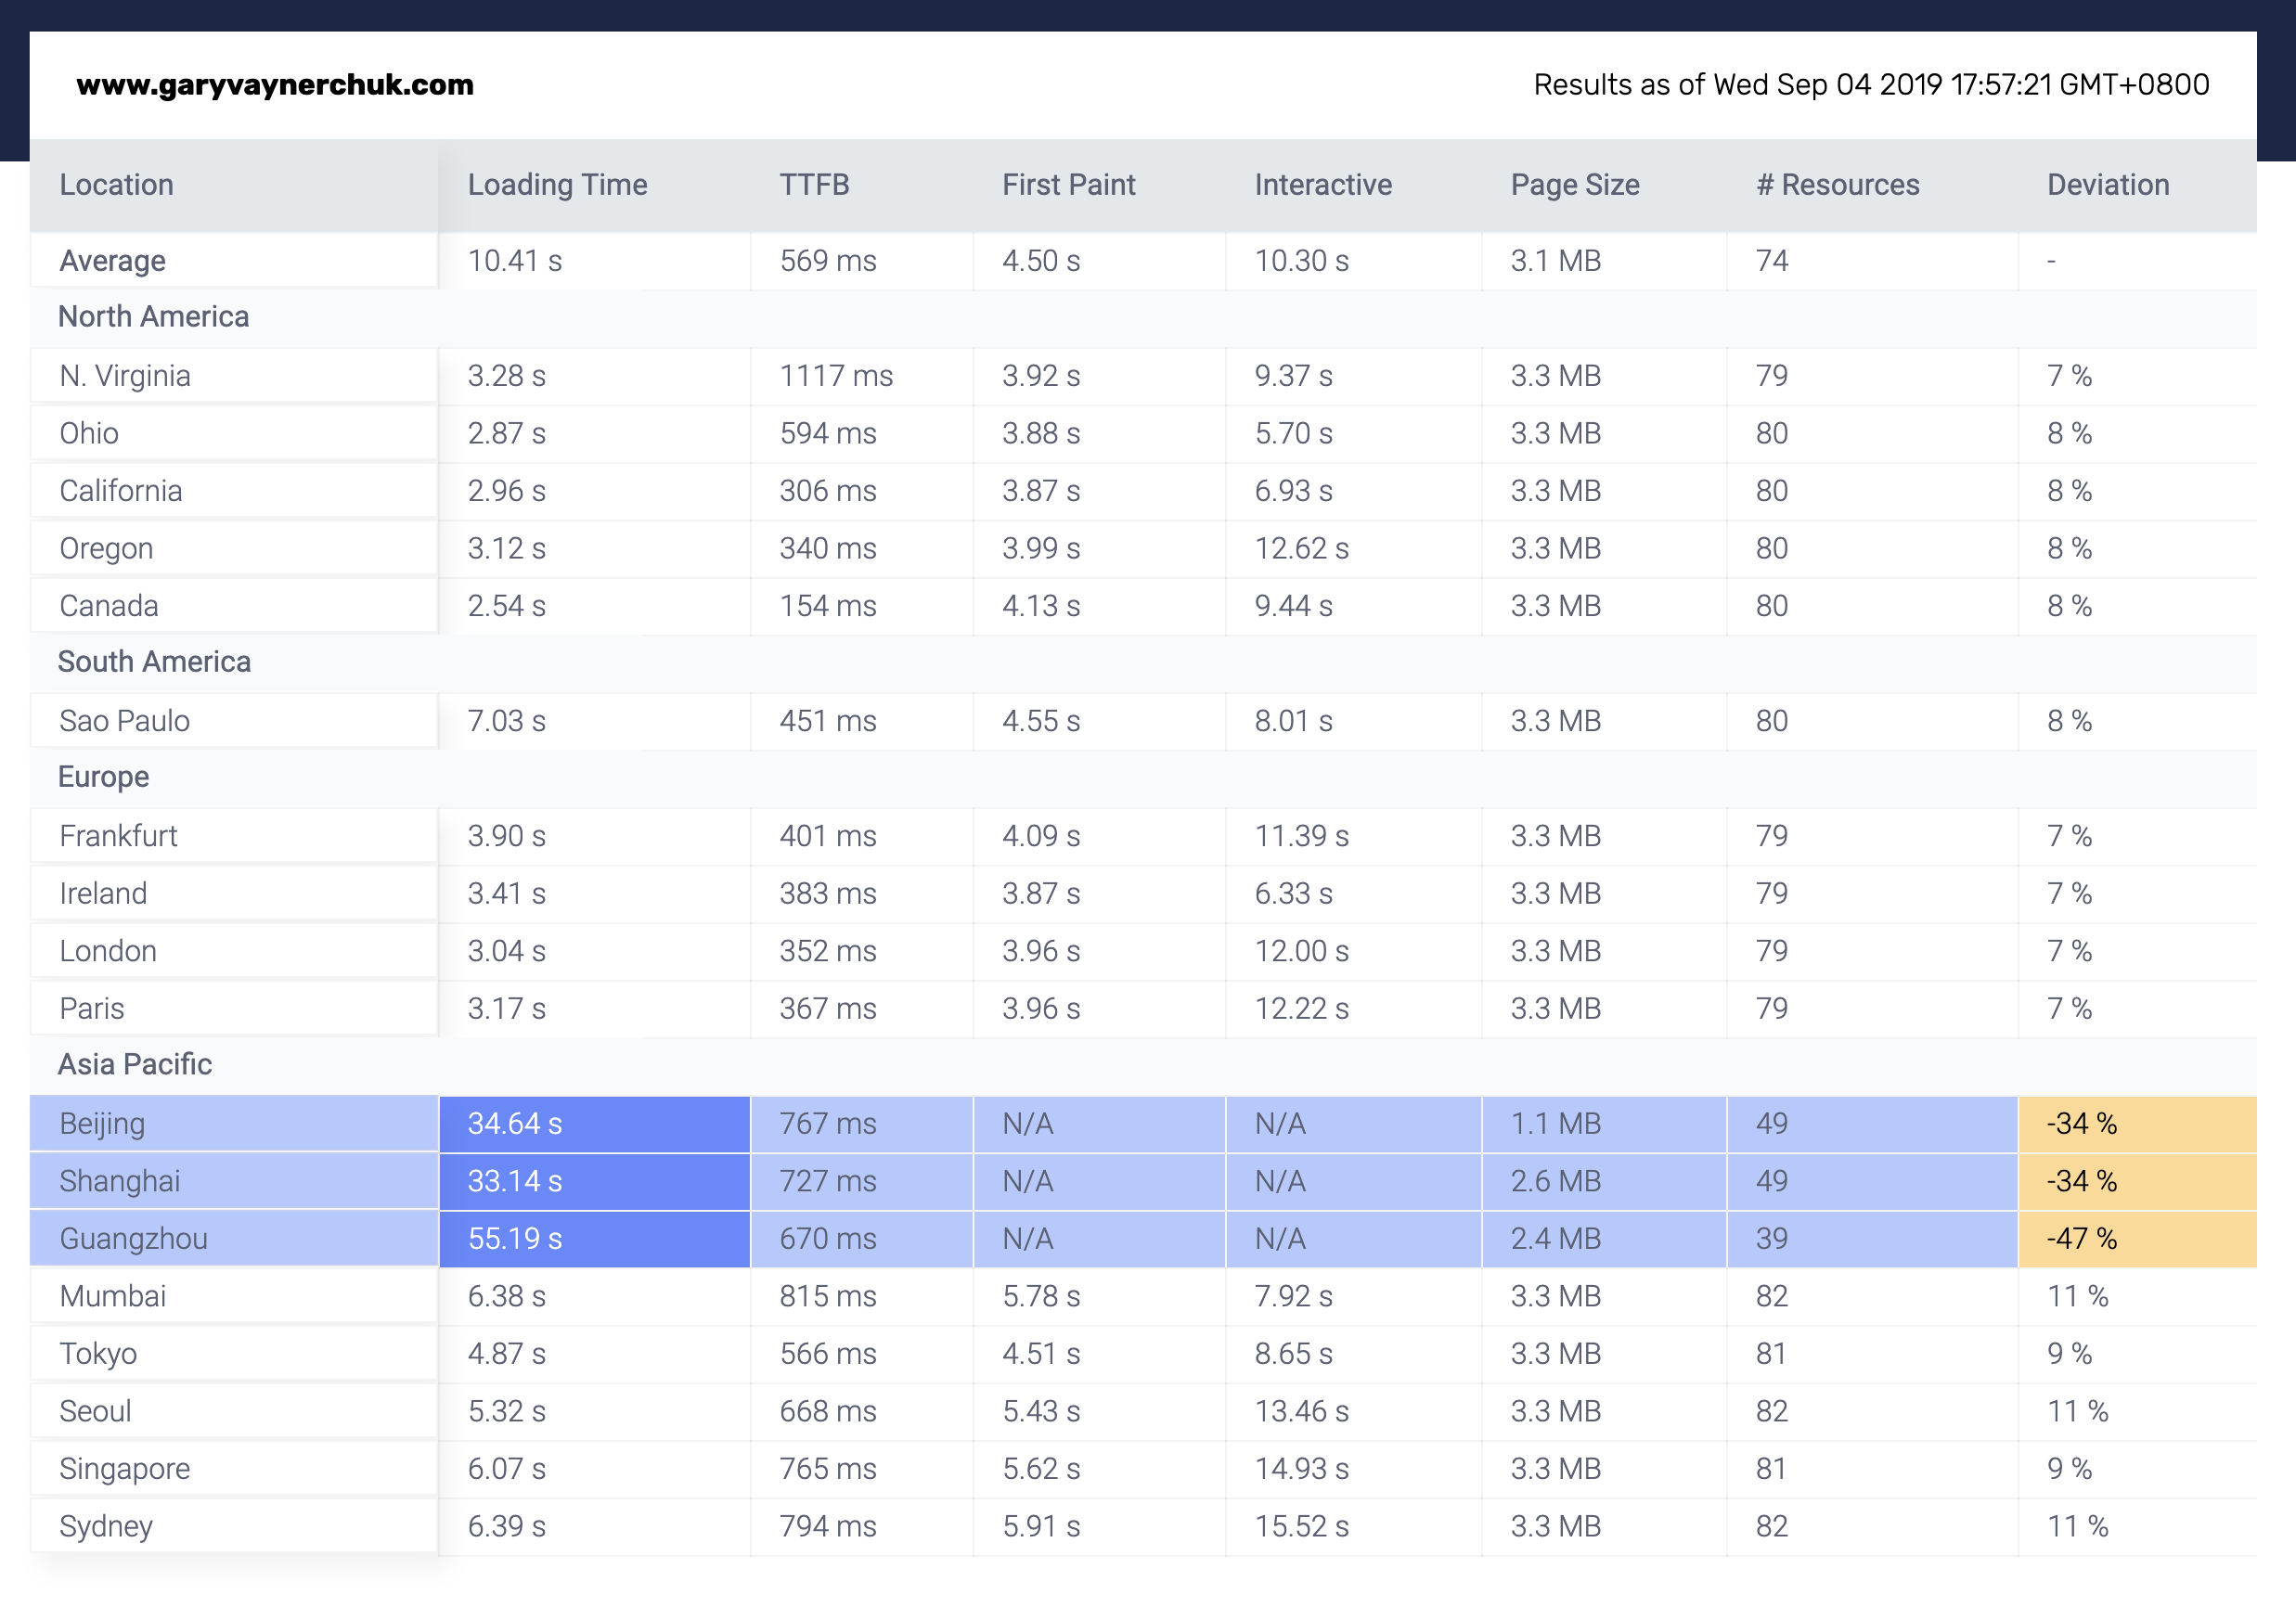
1 - Expected post-Chinafy results
The Best China Speed Test
As a team of engineers who spend their entire day evaluating, and optimizing around web performance, we’ve gone to great lengths to develop tools that evaluate, and monitor the different aspects of performance. One of the two most important aspects, is Speed (the other is Compatibility ).
China has generally two large telecom/infrastructure providers: China Unicom, and China Telecom. China Unicom is the more dominant provider to the North, with China Telecom covering the southern provinces. There’s also China Mobile - but as there’s limited connectivity between the two (or three), it’s important to measure speeds across China and not just in one location. For this reason, we’ve set up 18 servers around the world with 3 in China namely, Beijing, Shanghai, and Guangzhou.
Check out our China Speed Test, and a whole bunch of other Monitoring Tools here. Download our Chrome Plugin as well.
Here, we’ll discuss the Speed Test:

www.chinafy.com/speed-test
Network Settings: Latency & Throughput
The test allows you to evaluate page loading speeds under different network conditions. Internet traffic conditions change from moment-to-moment. Similar to driving a car, there may be periods of high traffic, or low traffic, and sometimes certain roads may be blocked. There are also multiple ways to get from Point A, to Point B. While these are largely out of your control, you can simulate traffic by trying out a few different conditions. These conditions we’ve defined in the table below, the main variables of which are: i) Latency, and ii) Throughput.
Latency: The time it takes data to get from ‘The Internet’ to your device (i.e. computer, or phone)
Bandwidth: Broken into a Download, and Upload speed - this is the volume of content (in megabytes or MBs) that can be transferred to your device per second.
The default setting is Good 3G. While 4G or LTE exists, we find 3G to be a closer proxy to reality, and WiFi misrepresentative of an ethernet-like connection given the inherent throttling capacity of the great firewall.
Name (Latency, Download Speed, Upload Speed)
GPRS (500ms, 50kb/s, 20kb/s)
Regular 2G (300ms, 250kb/s, 50kb/s)
Good 2G (150ms, 350kb/s, 150kb/s)
Regular 3G (100ms, 750kb/s, 250kb/s)
Good 3G (40ms, 1.5Mb/s, 750kb/s)
Regular 4G (20ms, 4.0Mb/s, 3.0Mb/s)
DSL (5ms, 2.0Mb/s, 1.0Mb/s)
Wifi (2ms, 30Mb/s, 15Mb/s)
Understanding the Results
We wish there was a simple definition to define when a page is ‘complete’ - if we wind the clock back 20yrs, there probably was, but in today’s internet, pages are so dynamic in nature with advertisements, chat bots, ad trackers - you name it, so it’s hard to determine when the page is actually, really, fully complete...for a human being. Thankfully, a number of smart people have put time into defining more human-based metrics than computer-based metrics which are sometimes helpful. In any event, let’s get down to business:

www.chinafy.com/speed-test
Loading Time
Basic Definition: It’s when your page is mostly, fully loaded. This is the metric we reference most often through our studies.
Advanced Definition: Following a DomComplete, we then evaluate any outstanding or trailing resources. When there are no more than 2 outstanding, and/or there is a gap of 5 seconds without firing any new resources, we then kill any remaining resources. This is important as in China, there are often a number of occupied/active connections stuck on blocked resources.
TTFB or Time-To-First-Byte
This is the time it takes from the moment you try to load a page (i.e. hitting Enter on your keyboard, or tapping a link on your phone) to the moment your browser receives its first byte of information. It’s like knocking on someone’s door and waiting until they say “I’m coming!” - until that point, you don’t know if they’re home or not.
First Paint (User Experience Metric)
While the TTFB is the moment your browser knows the site exists, it’s a technical definition and doesn’t mean that you as a human being can actually see anything on the page. When that first byte comes in, your page may still be blank. First Paint is the moment that something visibly happens on the page - it shows a color, it shows text. This is the moment when you think “a-ha” the page is now loading.
Time to Interactive (User Experience Metric)
When the page first starts to load, you can’t do much with it. Interactive refers to the time when you likely manipulate the page. That is, the page has displayed some information (via First Paint above), most of the visible components seem to be in place, and you can probably scroll, touch or manipulate the page. This is the moment you can typically ‘browse’ part of the page, although some of the content may not yet be in place
Resources
Web pages comprise of dozens, if not hundreds of components we call ‘Resources’. A resource is typically a photo, a video, a file - like a piece of Javascript that powers an image carousel, or a CSS file that defines which fonts, and colors should be on the page. Images and Videos typically are the largest files. We call a page Heavy when it has many files, or many large files. We call a page Light when it has few files, or few files.
The number of resources may differ from location-to-location as it’s hard to determine exactly when a page is complete (see Loading Time: Advanced Definition above) and some resources may not have loaded yet. In most cases you can expect a 2-4% deviation from one location to another.
In China, however, a number of components may be missing and often you’ll see much larger discrepancies in those areas. For this reason, we say pages are Incompatible in China, as the resources they rely on cannot be loaded under normal conditions.
Page Size
When you add these resources together you get the total Page Size. Similar to Resources, the size may differ from location-to-location as again - it’s hard to determine exactly when a page is complete
For the above reasons, we advise running the Speed Test a couple times to get a better understanding of how your pages load throughout the day. Sometimes they may be 60% complete, sometimes 80%, and sometimes they may not load at all. For most foreign sites in China, this is normal.
While First Paint, and Interactive are arguably better definitions of when pages are usable by normal people they do not capture enough the detail lost in incompatible resources.. Whether these metrics are faster in China, it doesn’t necessarily mean much has changed for your visitors- there are likely to be a number of missing components or poorly performing resources which is where our China Code Test comes in handy. For this reason, we use Loading Time as our key metric.
If Speed, Compatibility, and Reliability are important, reach out to us and Chinafy your site today.
Notes:
If you’d like to monitor loading time over a period of hours, check out our Time Series Analysis tool (coming soon!).
We’re always looking to improve on this speed test, and hope you find it useful. For other tests, check out our other China Audit and Monitoring Tools!


1 - Expected post-Chinafy results


