1 - Expected post-Chinafy results
The Ultimate China Web Study: How do Foreign Sites Actually Load in China? Part 2
Part 2: Aggregate Site Performance
---
This is part 2 of a 4-part series on studying how foreign sites load in China. For more information please check out:
Part 3: Single Site Performance
Part 4: Single Site Detailed Breakdown
---
We evaluated 10 websites over 7 days, loading them from different regions in China. In this part we look at the aggregate, or overall performance. Are there any trends? Problems? Opportunities? Let’s find out looking firstly at Loading Time:
Average Loading Time
Average Time: 28.6 secs
St Deviation: 8 secs
Over the 7 days, we see clear cyclicality linked to the time of day. Sites are fastest at night loading in about 17-18 secs when internet bandwidth demands are low, and slowest basically at most times throughout the day (the dates in the graph below align with the beginning of the day, or ‘midnight’) loading in about 33-34 secs.
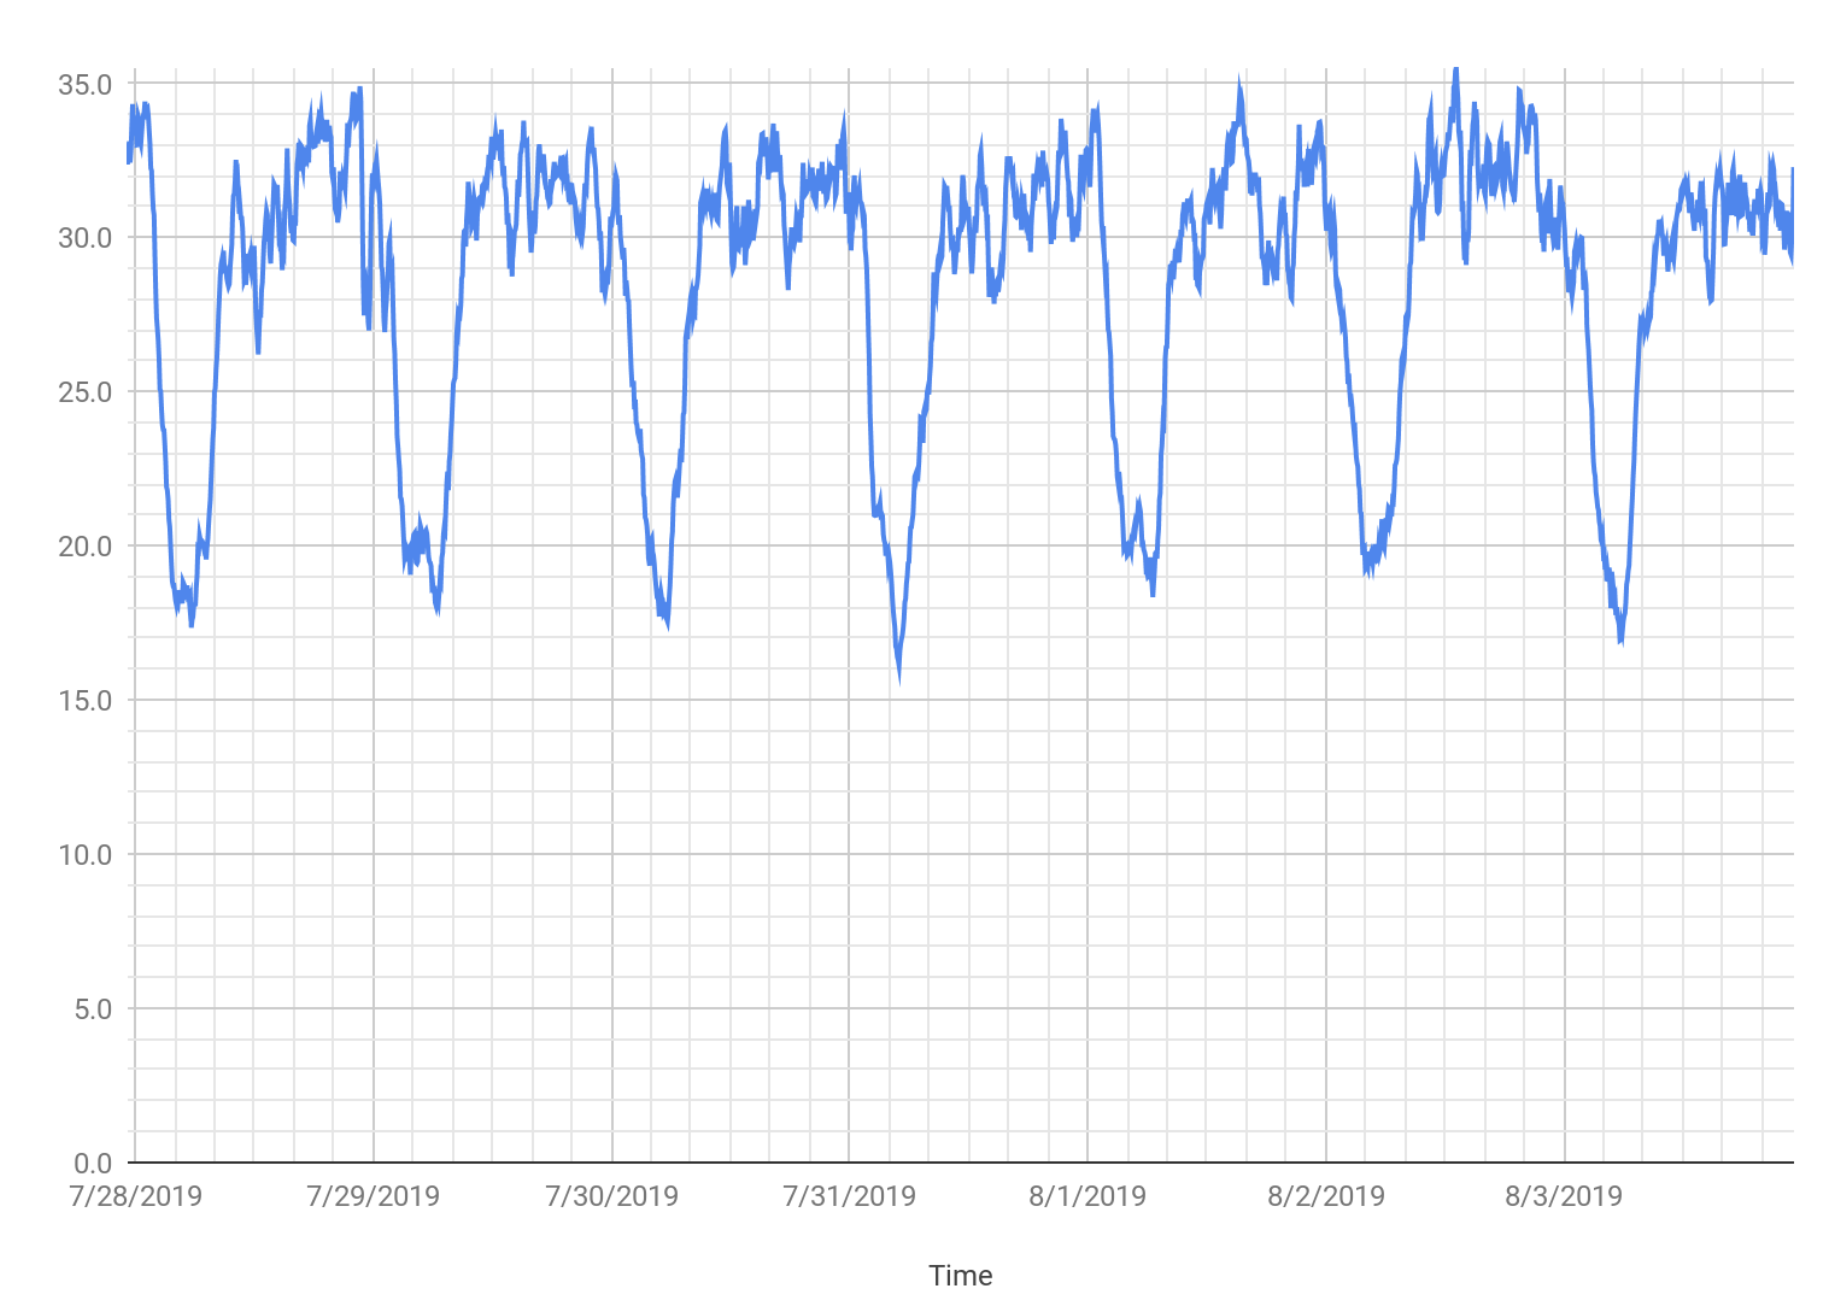
Graph 1: Aggregate Time Series Analysis, Source: chinafy.com
When we layer the daily data on top of one another, we see the fastest times from 4-6am, with the slowest times at:
4pm
7pm
9-10:30pm
You can almost picture when they’re going to work, eating lunch, on their way home, and eating dinner.
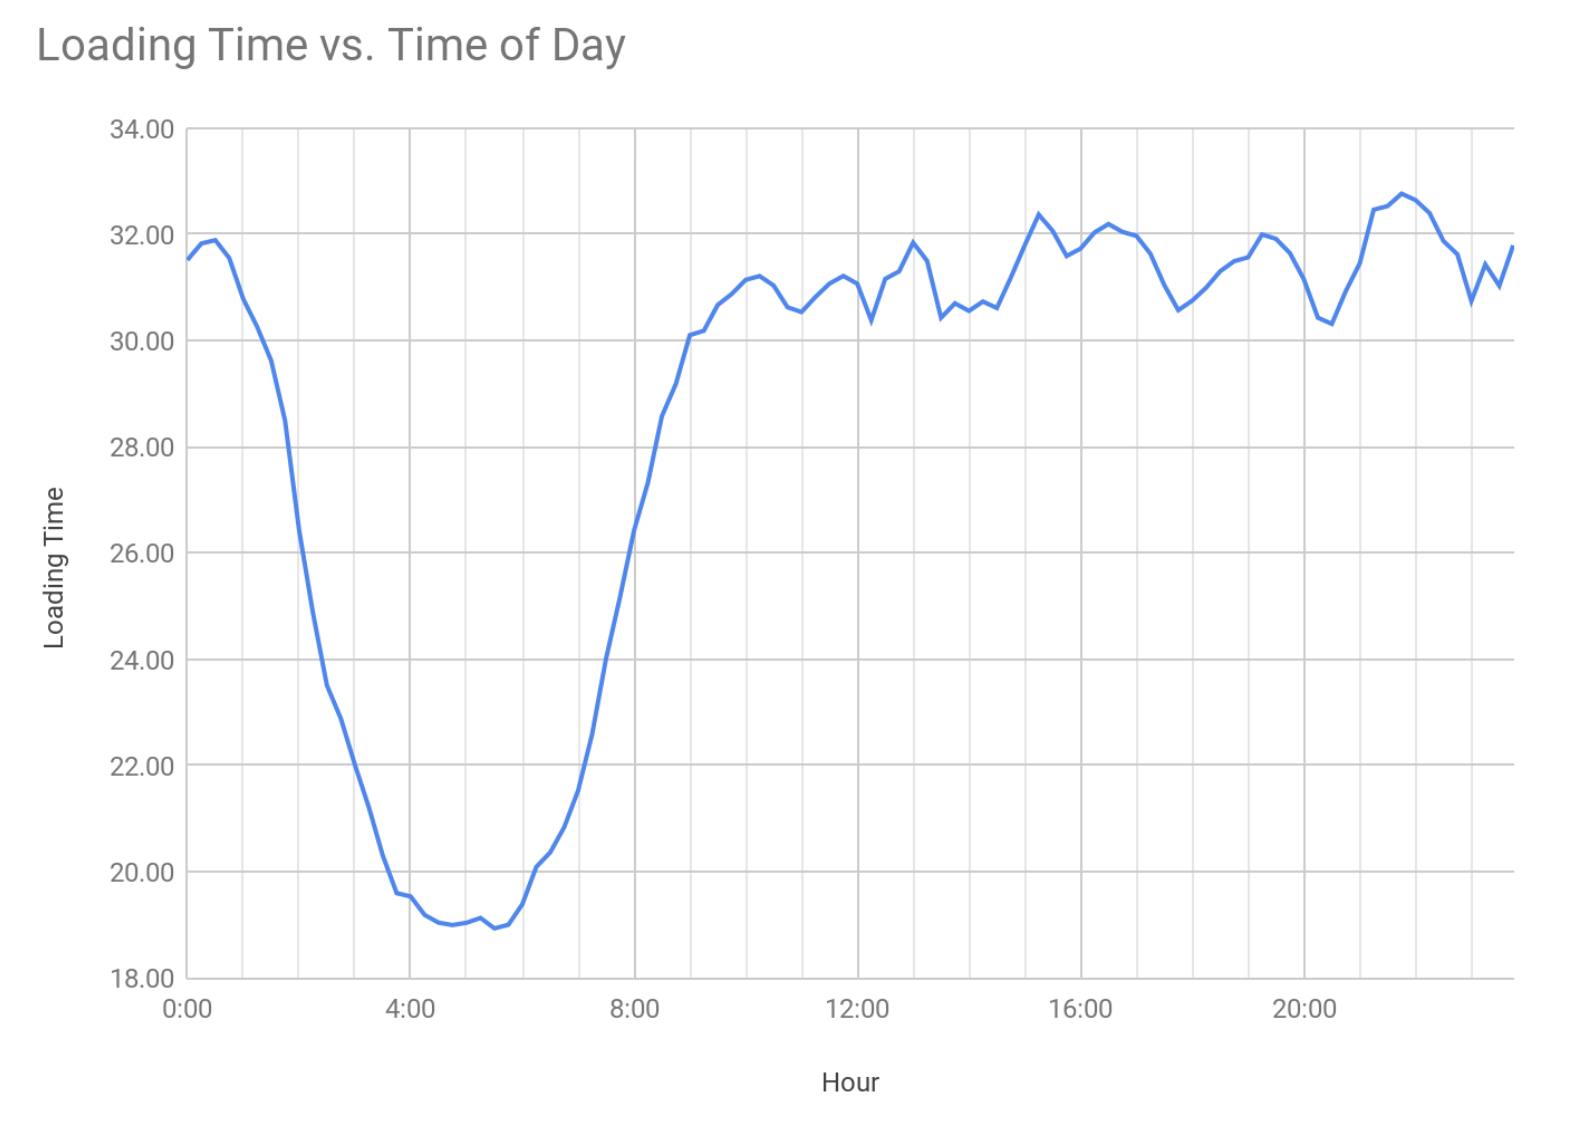
Graph 2: Loading Time vs Time of Day, Source: chinafy.com
Loading Time Frequency
For a single site (or thousands of sites), we typically expect a somewhat lognormal, or right-skewed distribution that centres around the 30-second mark. In this case, there appear to be two, potentially three key regions of interest. Note that our tests physically stops trying to load sites after 60 seconds (you'd be surprised how many sites take 3-5 minutes to complete), hence the cutoff.
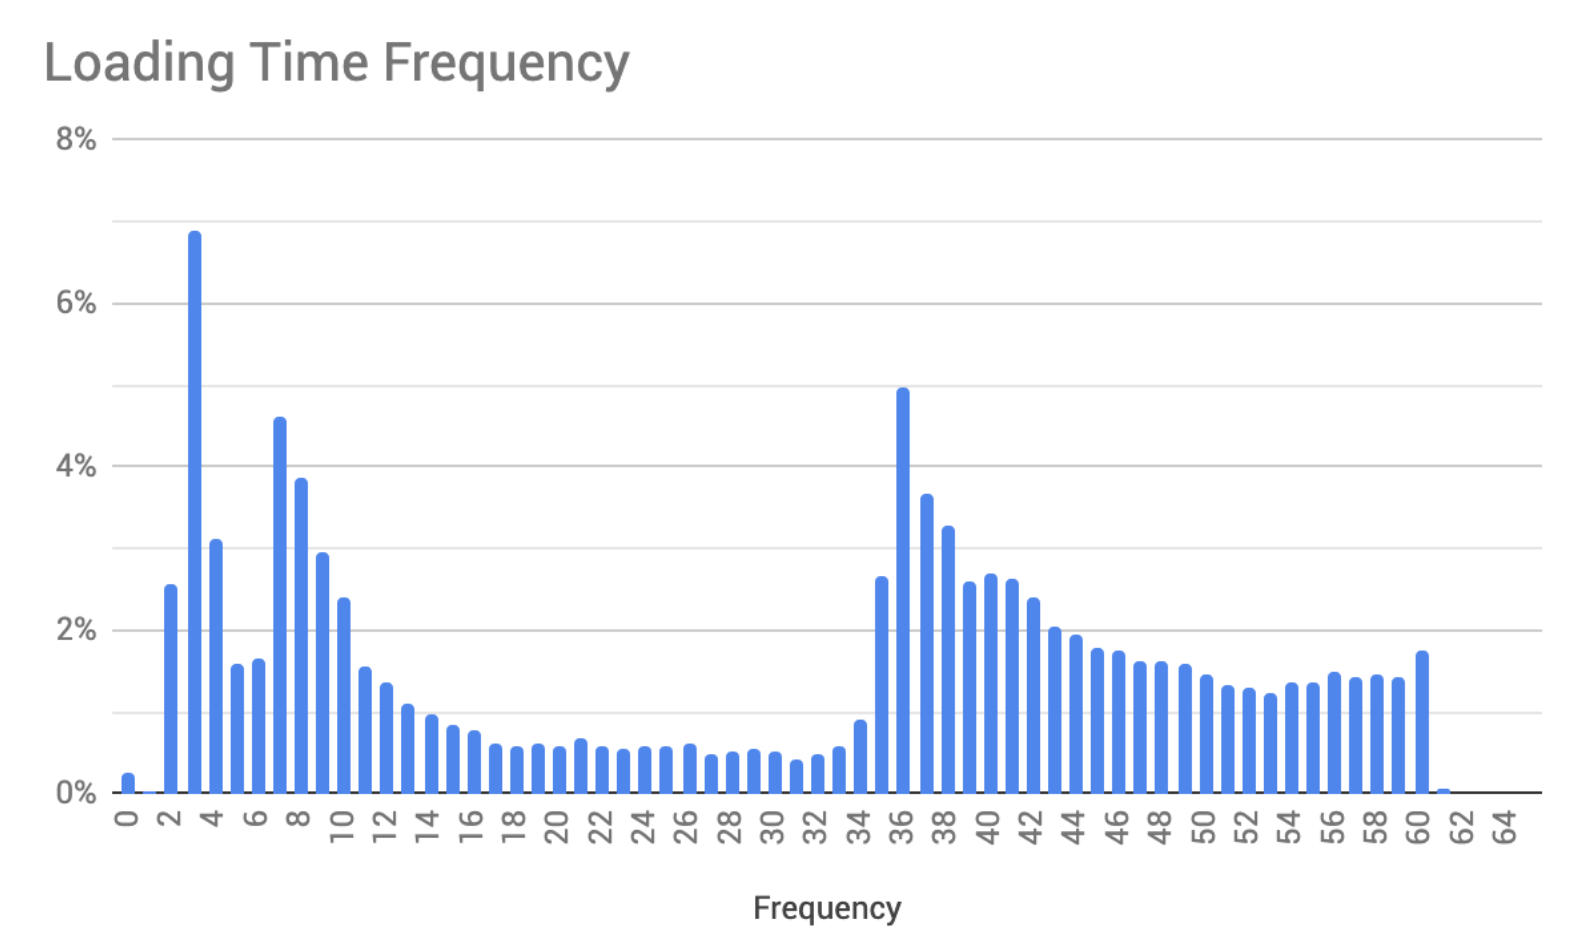
Graph 3: Aggregate Loading Time Histogram, Source: chinafy.com
Looking at the above histogram, it’s hard really to understand why it’s the case but we’ll later look into the idiosyncratic effects of each specific site. Thankfully, we captured more data than just Loading Times - let’s now look at the % of the page that was loaded, or what we call % of Page Complete.
% of Page Complete
As a recap, each page is comprised of perhaps ~100 resources or so on average. Some of these may be images, fonts, snippets of Javascript, and a number of other components that combine together to create the page. Each time the page loads, we record exactly how many of these ~100 resources load successfully, measuring the amount of data retrieved (i.e. megabytes, or MBs) , and then comparing this versus the intended or ‘full size’ of a page.
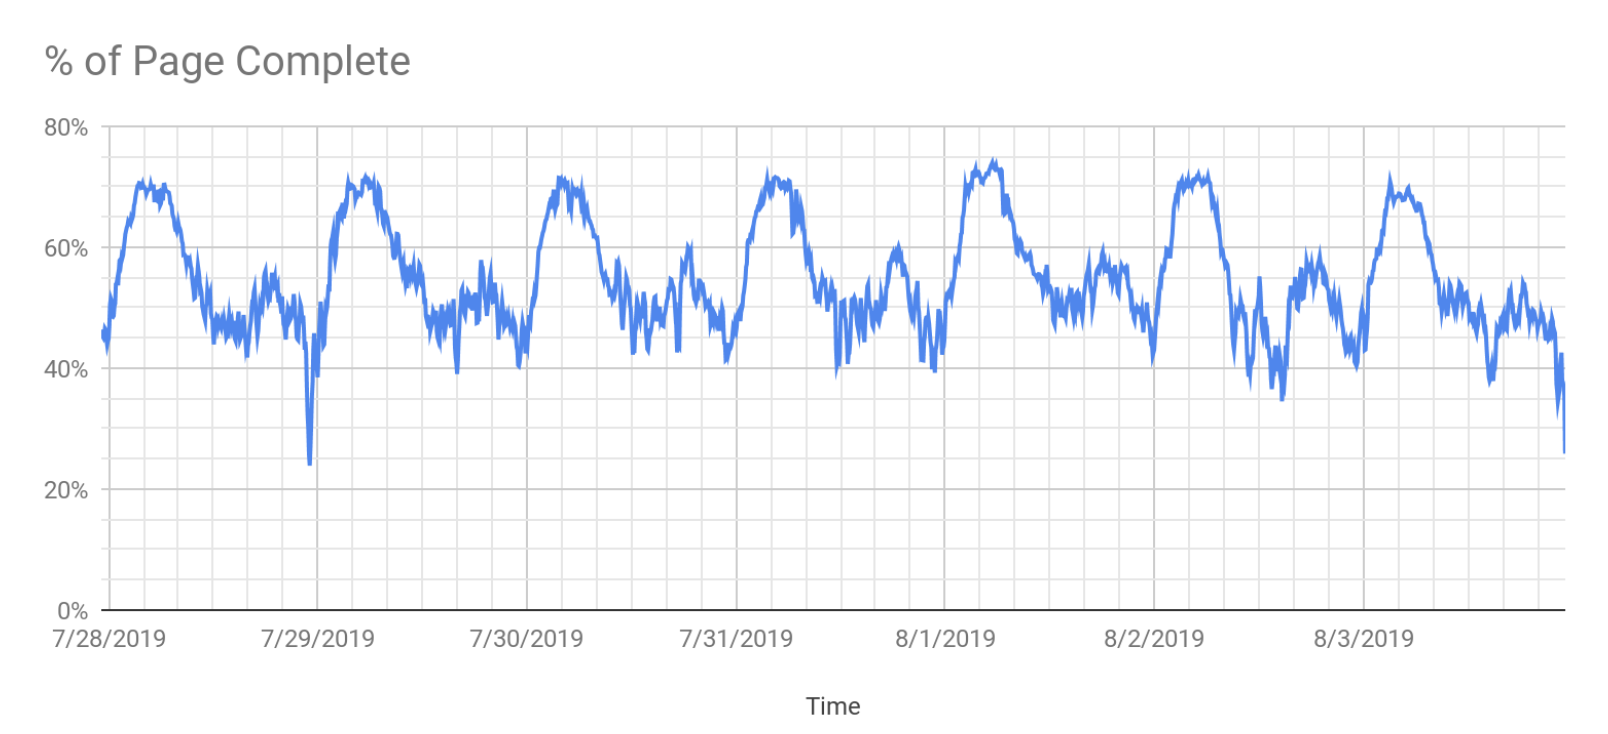
Graph 4: % of Page Complete Time Series, Source: chinafy.com
You can see 7 clear times when the pages were loading more fully - in the 70% context. These however, are unsurprisingly at 3-4am in the morning when few are awake and internet demands are limited. Given the cyclical nature of both Loading Time and % Page Complete, we propose a few questions:
Is page loading time correlated with the % of the page loaded?
Do pages that ‘generally’ load more slowly load less resources?
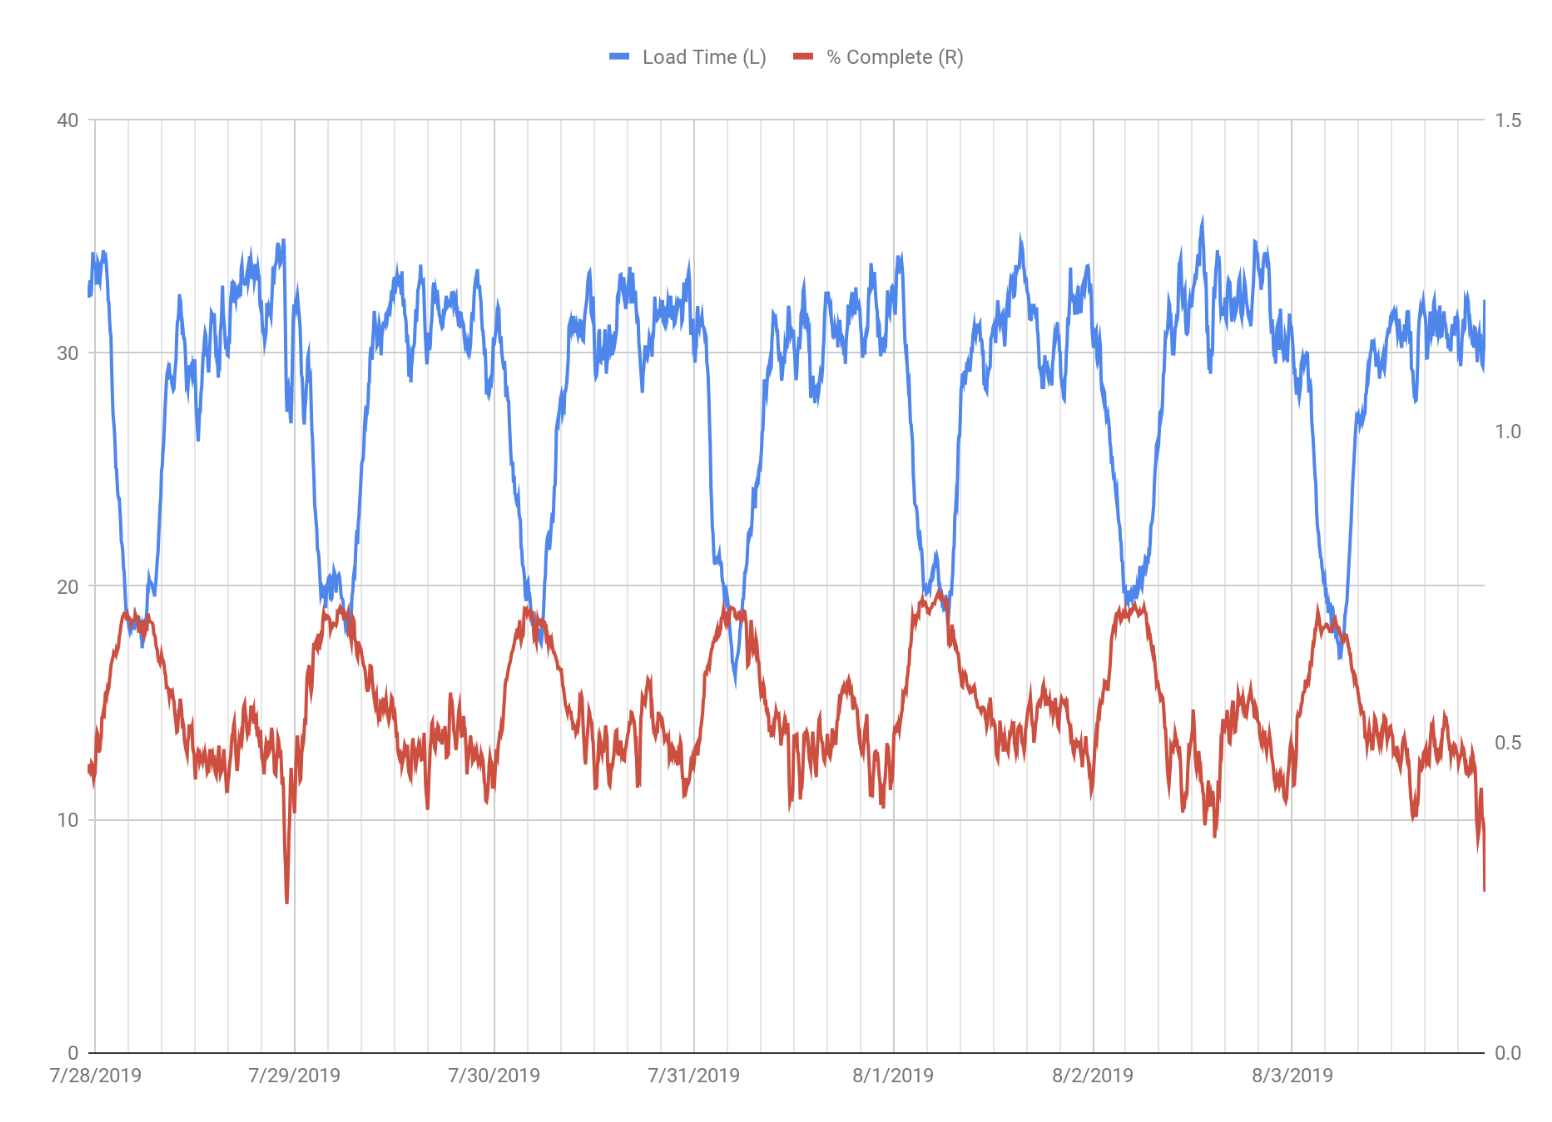
Graph 5: Loading Time vs % Page Complete Time Series, Source: chinafy.com
The answer to both questions is: Yes.
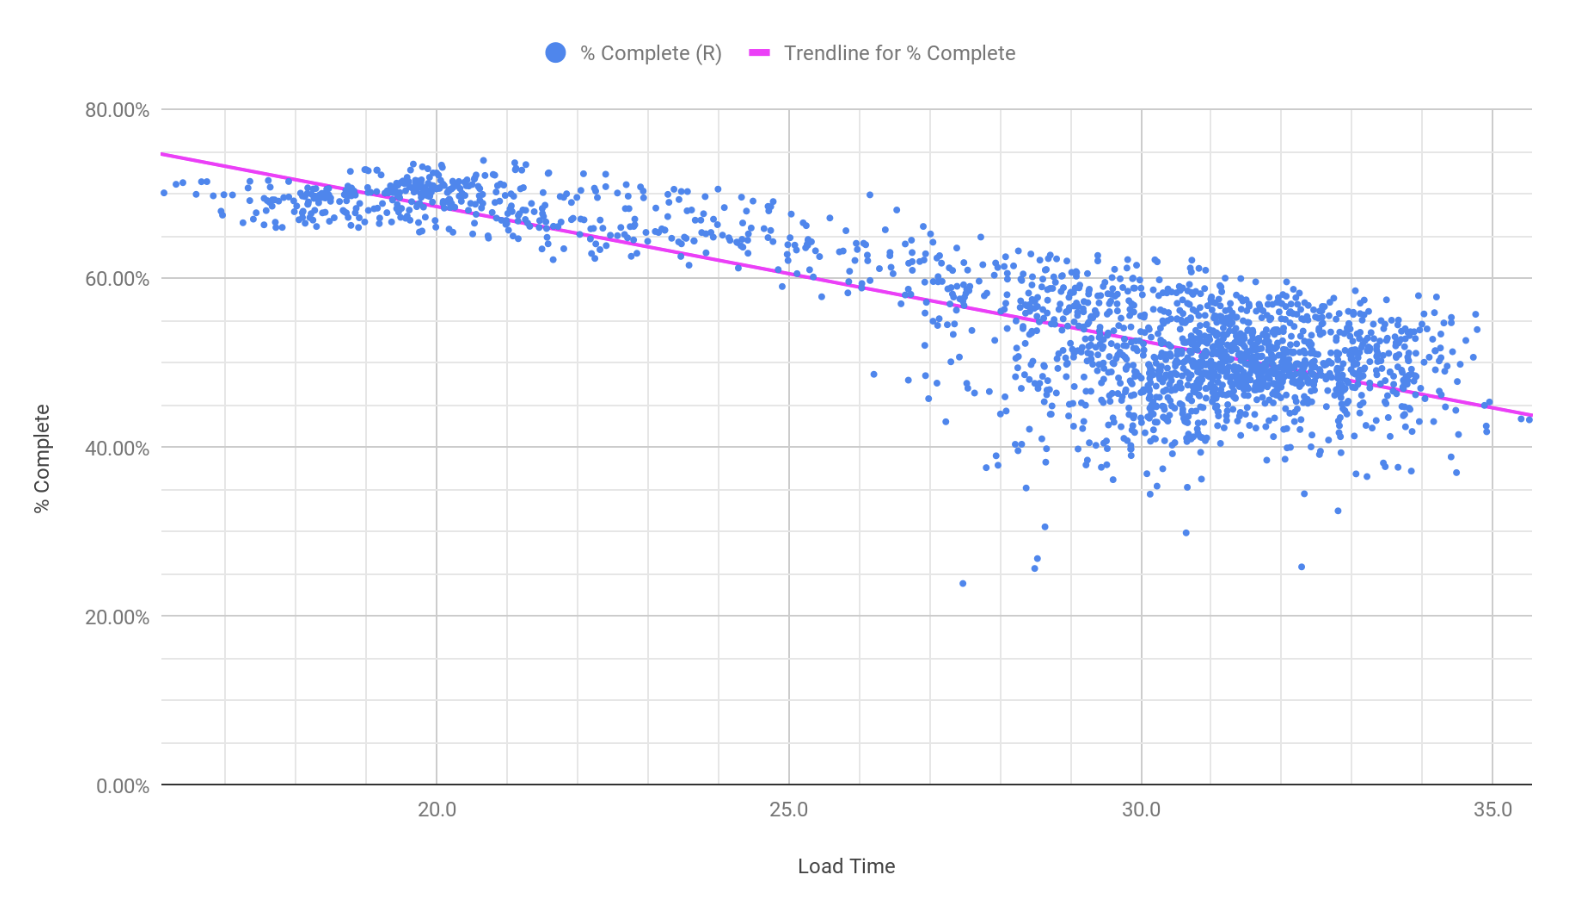
Graph 6: Loading Time vs % Page Complete Scatterplot, Source: chinafy.com
On an aggregate basis (i.e. when looking at averages) Load Time vs the % of Page Completed is -85% correlated (i.e. inversely correlated), with a strong 72% significance. In addition to this, at times of least demand (i.e. at 4am) sites are able to load more resources - around 70% vs 50% normally.
Are pages that load quickly actually more broken?
The problem with the above graphs is that nobody’s loading sites are 4am. Looking back at “Graph 3: Aggregate Loading Time Histogram”, we try to understand why some pages load quickly ”on rare occasions”. For this experiment, we:
Stop using aggregate or averaged data across the 10 sites
Start looking at metrics on a single-site basis
Normalize Page Loading Time on a 0-100% basis
Eliminate any data from the night time when nobody is online
This allows us to regress the % of Page Speed vs % of Page Complete during the ‘daytime’ when we actually care about people loading websites.
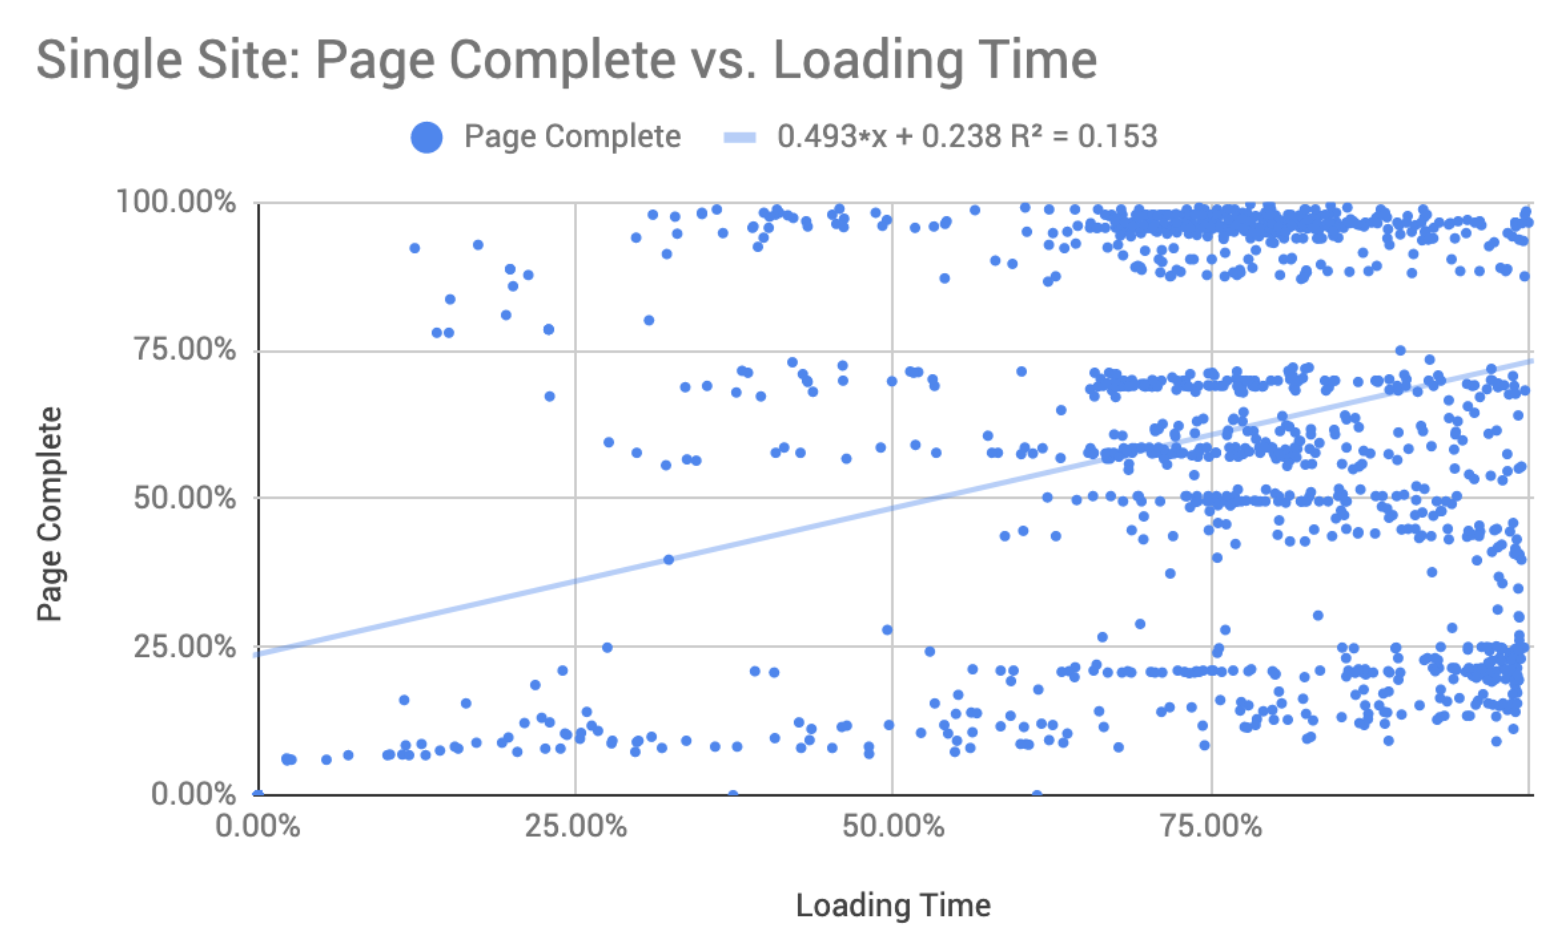
Graph 7: % Page Complete vs Loading Time, Source: chinafy.com
With Disneyland above, we can see that (most of) the times the site was fast (i.e. to the left on the x-axis), it delivered less than 25% of the Page Complete (y-axis).
When we compare % Loading Time vs % Page Complete across the 10 sites taking individual data points, and not averages, we see an opposite relationship to what we saw on a macro basis. We see a positive 47% correlation, and a 24% significance indicating loosely that:
When sites load quickly, it’s usually because more resources failed
It means these ‘fast loading times during the day’ were largely erroneous with incomplete pages!
How much of the Pages Actually Load?
It’s 55%, on average - for these ten sites. We can dive into this data all day long but we’ll take a step back now and assess how we can present the data in a simple shareable chart(!).
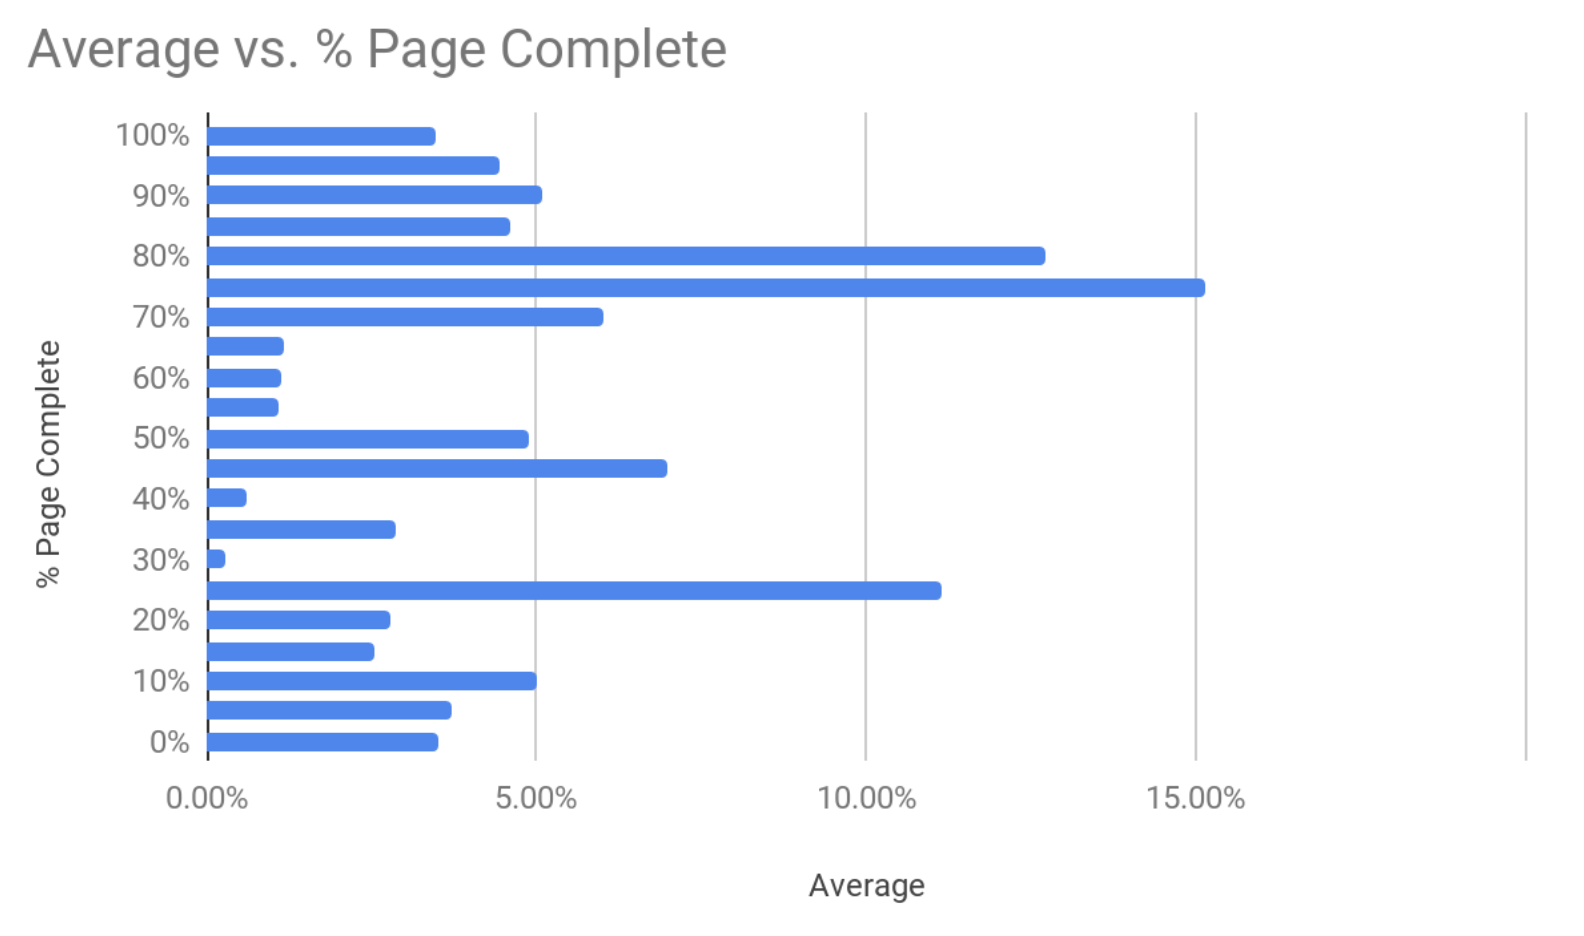
Graph 8: % Page Complete, Source: chinafy.com
From this, we can see that pages load to about the 55% mark on average, and frequently see less than 50% of the page displaying (this is already after 30 seconds mind you!)
Wrapping up, the purpose of the above experiments are to delineate and quantify the behavior we see across sites loading in China. At the end of the day, we understand that pages are slow, and frequently, components are missing. What’s important is understanding the dynamics of why your site is slow, and how you can fix it.
Read More: Part 3: Single Site Performance


1 - Expected post-Chinafy results


